Be yourself; Everyone else is already taken.
— Oscar Wilde.
This is the first post on my new blog. I’m just getting this new blog going, so stay tuned for more. Subscribe below to get notified when I post new updates.
Be yourself; Everyone else is already taken.
— Oscar Wilde.
This is the first post on my new blog. I’m just getting this new blog going, so stay tuned for more. Subscribe below to get notified when I post new updates.
Voskoboinik A, Kalman JM, De Silva A, et al. Alcohol Abstinence in Drinkers with Atrial Fibrillation. N Engl J Med. 2020;382(1):20–28. doi:10.1056/NEJMoa1817591
Was the assignment of patients to treatments randomized?
–Yes, patients were randomized by a computerized central randomization in a 1:1 ratio.
Were all the patients who entered the trial properly accounted for and attributed at its conclusion?
– Some patients were excluded or did not have some portions of data available at the conclusion of the trial. I felt as though this was accounted for in general though.
Was follow-up complete?
– I believe follow up was very impressive though not entirely complete. 137/140 patients completed a 6 month follow up with complete rhythm data and alcohol history available.
Were patients analyzed in the groups to which they were randomized?
– yes. There was no shifting of patients between the abstinence and control group based on actual volume of alcohol consumed.
Were patients, health workers, and study personnel blind to treatment?
–Patients were not blinded as they had to be informed in order to alter their alcohol consumption PRN. I did not see if health workers were explicitly blinded however study personnel performing statistical analysis were blinded.
Were the groups similar at the start of the trial?
–Yes, per table 1
Aside from experimental intervention, were the groups treated equally?
– Yes, there was no treatment administered outside the experimental “treatment”.
| 1a | Identification as a randomized trial in the title | No | |
| 1b | Structured summary of trial design, methods, results, and conclusions (for specific guidance see CONSORT for abstracts) | yes | |
| Introduction | |||
| Background and objectives | 2a | Scientific background and explanation of rationale | Not really |
| 2b | Specific objectives or hypotheses | Again, not very specific | |
| Methods | |||
| Trial design | 3a | Description of trial design (such as parallel, factorial) including allocation ratio | yes |
| 3b | Important changes to methods after trial commencement (such as eligibility criteria), with reasons | Yes, shortened from 12 months to 6 months | |
| Participants | 4a | Eligibility criteria for participants | yes |
| 4b | Settings and locations where the data were collected | yes | |
| Interventions | 5 | The interventions for each group with sufficient details to allow replication, including how and when they were actually administered | yes |
| Outcomes | 6a | Completely defined pre-specified primary and secondary outcome measures, including how and when they were assessed | yes |
| 6b | Any changes to trial outcomes after the trial commenced, with reasons | n | |
| Sample size | 7a | How sample size was determined | n |
| 7b | When applicable, explanation of any interim analyses and stopping guidelines | n | |
| Randomisation: | |||
| Sequence generation | 8a | Method used to generate the random allocation sequence | online |
| 8b | Type of randomisation; details of any restriction (such as blocking and block size) | – | |
| Allocation concealment mechanism | 9 | Mechanism used to implement the random allocation sequence (such as sequentially numbered containers), describing any steps taken to conceal the sequence until interventions were assigned | – |
| Implementation | 10 | Who generated the random allocation sequence, who enrolled participants, and who assigned participants to interventions | – |
| Blinding | 11a | If done, who was blinded after assignment to interventions (for example, participants, care providers, those assessing outcomes) and how | Cardiologists were blinded if interpreting ECGs |
| 11b | If relevant, description of the similarity of interventions | – | |
| Statistical methods | 12a | Statistical methods used to compare groups for primary and secondary outcomes | yea |
| 12b | Methods for additional analyses, such as subgroup analyses and adjusted analyses | yes | |
| Results | |||
| Participant flow (a diagram is strongly recommended) | 13a | For each group, the numbers of participants who were randomly assigned, received intended treatment, and were analysed for the primary outcome | yes |
| 13b | For each group, losses and exclusions after randomisation, together with reasons | yes | |
| Recruitment | 14a | Dates defining the periods of recruitment and follow-up | yes |
| 14b | Why the trial ended or was stopped | yes | |
| Baseline data | 15 | A table showing baseline demographic and clinical characteristics for each group | yes |
| Numbers analysed | 16 | For each group, number of participants (denominator) included in each analysis and whether the analysis was by original assigned groups | yes |
| Outcomes and estimation | 17a | For each primary and secondary outcome, results for each group, and the estimated effect size and its precision (such as 95% confidence interval) | yes |
| 17b | For binary outcomes, presentation of both absolute and relative effect sizes is recommended | – | |
| Ancillary analyses | 18 | Results of any other analyses performed, including subgroup analyses and adjusted analyses, distinguishing pre-specified from exploratory | yes |
| Harms | 19 | All important harms or unintended effects in each group (for specific guidance see CONSORT for harms) | – |
| Discussion | |||
| Limitations | 20 | Trial limitations, addressing sources of potential bias, imprecision, and, if relevant, multiplicity of analyses | yes |
| Generalisability | 21 | Generalisability (external validity, applicability) of the trial findings | – |
| Interpretation | 22 | Interpretation consistent with results, balancing benefits and harms, and considering other relevant evidence | yes |
| Other information | |||
| Registration | 23 | Registration number and name of trial registry | – |
| Protocol | 24 | Where the full trial protocol can be accessed, if available | yes |
| Funding | 25 | Sources of funding and other support (such as supply of drugs), role of funders | yes |
Critical appraisal:
I believe this study is methodologically sound. There are no major flaws within the study design itself. There were relatively significant portions of data missing pertaining to secondary endpoints, which was acknowledged by the authors.
Compare and contrast User’s with CONSORT:
Though User’s Guide continues to be my preferred manner of article appraisal, the CONSORT checklist did provide me with reassurance of the validity of the trial that I don’t think I would have reached with User’s Guide alone. Going forward I will definitely use User’s Guide but may employ CONSORT when evaluating therapy studies that I find difficult to interpret or adequately evaluate their design validity.
Math:
What is the outcome you want to use and what is the baseline risk of the outcome for patients in the study? (It’s the event rate of control group in the study. Need to know risk of the outcome without any treatment.)
-My outcome is freedom of recurrence of atrial fibrillation in “Adults (without alcohol use disorder) who consumed 10 or more standard drinks (with 1 standard drink containing approximately 12 g of pure alcohol) per week and who had paroxysmal or persistent atrial fibrillation in sinus rhythm at baseline.” Event rate of the control group (no intervention) was 73% had an AF recurrence recorded by 6 months.
What is the RRR and the NNT for this outcome from the study?
-The RRR in the abstinence group was 27.4%
-ARR between the control (73%) and abstinence group (53%) was 20%
-NNT was 5. 1/(0.2) = 5
Using those as a baseline, calculate the following patient-specific NNTs:
Nurse study: Are the results of the study valid?
Primary guide:
Were there clearly identified comparison groups that were similar with respect to important determinants of outcome, other than the one of interest?
-Yes there were clearly definied comparison groups what were overall similar. Differences between the groups were identified and addressed within the paper.
Were the outcomes and exposures measured in the same way in the groups being compared?
-Yes
Was follow up sufficiently long and complete?
– follow up was long at 16 years and complete in that the vast majority were not lost to follow up. However, I’m not sure if 16 years is truly sufficient as some individuals take these medications for seemingly indefinite periods of time. You would hope this is long enough but is hard for me to truly “know”.
Secondary guide:
Is the temporal relationship correct?
-yes.
Is there a dose-response gradient?
-yes, for estrogen therapy there was an dose response gradient on CV outcomes within the study.
| Title and abstract | 1 | (a) Indicate the study’s design with a commonly used term in the title or the abstract -Yes-in the abstract |
| (b) Provide in the abstract an informative and balanced summary of what was done and what was found -Yes | ||
| Introduction | ||
| Background/rationale | 2 | Explain the scientific background and rationale for the investigation being reported -Epidemiologic data suggest estrogen alone in PMW decreases CAD. Little data on combined HRT. Experimental data suggesting progestin component diminished cardioprotective effects of estrogen only HRT. |
| Objectives | 3 | State specific objectives, including any prespecified hypotheses -Relation between combined HRT and CVD. No explicit hypothesis in intro |
| Methods | ||
| Study design | 4 | Present key elements of study design early in the paper -Mailed questionnaire to ~122k women nurses aged 30-55. Followed up with questionnaires and confirmed- responses of interest with medical records if possible. |
| Setting | 5 | Describe the setting, locations, and relevant dates, including periods of recruitment, exposure, follow-up, and data collection 1976-1992, nurses who responded to a mail in questionnaire. Exposure of HRT, diet, physical activity etc. |
| Participants | 6 | Give the eligibility criteria, and the sources and methods of selection of participants. Describe methods of follow-up -Female nurses who responded. Follow with biennial questionaires. |
| Variables | 7 | Clearly define all outcomes, exposures, predictors, potential confounders, and effect modifiers. Give diagnostic criteria, if applicable “Cardiovascular disease was defined as nonfatal myocardial infarction, fatal coronary disease, coronary-bypass surgery or angioplasty, and fatal or nonfatal stroke occurring during the period between the return of the 1976 questionnaire and June 1, 1992.” The rest was explained under “documentation of CVD” Excluding all MI of indeterminate age seemed like an interesting population to exclude. Patient’s with “silent Mis” can still suffer significant morbidity and would have been interested to study their correlation with HRT. If the person had mentioned a history of MI on their initial survey, they would have been excluded but these individuals were included and then later excluded. |
| Data sources/ measurement | 8* | For each variable of interest, give sources of data and details of methods of assessment (measurement). Describe comparability of assessment methods if there is more than one group – Criteria used to verify CVD was per WHO guidelines. Confirming death via CVD were confirmed with more than just a death certificate designation. |
| Bias | 9 | Describe any efforts to address potential sources of bias -they adjusted for variables such as age, age at menopause, body-mass index (the weight in kilograms divided by the square of the height in meters), cigarette smoking, hypertension, diabetes, elevated cholesterol levels, and many for |
| Study size | 10 | Explain how the study size was arrived at -By the number of female nurses within the age range who responded to a mail in questionnaire |
| Quantitative variables | 11 | Explain how quantitative variables were handled in the analyses. If applicable, describe which groupings were chosen and why -saturated-fat intake (in quintiles), alcohol use (none, 5 g, 5 to 14.9 g, or 15 g per day), use of vitamin E (none, 100 IU, 100 to 299 IU, 300 to 599 IU, or 600 IU per day) or multivitamins (yes or no), use of aspirin (none or 1 to 6 pills or 7 pills a week), and physical activity (none or at least once per week) – these quantitative variables were grouped but there was no expansion into the rationale of each grouping criteria. |
| Statistical methods | 12 | Describe all statistical methods, including those used to control for confounding -Each pariticpant was allocated to categories of hormone use by person-months according to 1976 data and updated every 2 years -Proportional-hazards models were used to calculate relative risks for things such as age and BMI |
| Describe any methods used to examine subgroups and interactions -relative risk was used as the measure of association. The used five year categories for age specific rates to calculate age-adjusted relative risk with 95% CI.” Tests of trends across categories of exposure were calculated by treating the levels of exposure as a continuous, ordinal variable in the regression model.” | ||
| (c) Explain how missing data were addressed | ||
| If applicable, explain how loss to follow-up was addressed I saw little to no mention | ||
| (e) Describe any sensitivity analyses RR w/ 95%CI | ||
| Results | ||
| Participants | 13* | Report numbers of individuals at each stage of study—eg numbers potentially eligible, examined for eligibility, confirmed eligible, included in the study, completing follow-up, and analysed -21.726 included in 1976 and 37-611 added during follow up for a total of 662,891 person years of follow up between 1976-1992 |
| Give reasons for non-participation at each stage -initiall excluded if they reported h/o stroke, MI, angina or cancer and subsequently excluded if they reported any of these on a later questionnaire | ||
| ( | ||
| Descriptive data | 14* | (a) Give characteristics of study participants (eg demographic, clinical, social) and information on exposures and potential confounders as above |
| Indicate number of participants with missing data for each variable of interest -3.2% had missing data related to hormone use | ||
| (c) Summarise follow-up time (eg, average and total amount) | ||
| Outcome data | 15* | Report numbers of outcome events or summary measures over time -584 nonfatal myocardial infarctions, 186 deaths due to coronary disease, 572 strokes (285 ischemic events, 155 subarachnoid hemorrhages, and 132 other or unspecified types), and 553 instances of coronary surgery or angioplasty |
| Main results | 16 | (a) Give unadjusted estimates and, if applicable, confounder-adjusted estimates and their precision (eg, 95% confidence interval). Make clear which confounders were adjusted for and why they were included -yes |
| Report category boundaries when continuous variables were categorized -n/a | ||
| If relevant, consider translating estimates of relative risk into absolute risk for a meaningful time period -n/a | ||
| Other analyses | 17 | Report other analyses done—eg analyses of subgroups and interactions, and sensitivity analyses -n/a |
| Discussion | ||
| Key results | 18 | Summarise key results with reference to study objectives -These were summarized |
| Limitations | 19 | Discuss limitations of the study, taking into account sources of potential bias or imprecision. Discuss both direction and magnitude of any potential bias -yes |
| Interpretation | 20 | Give a cautious overall interpretation of results considering objectives, limitations, multiplicity of analyses, results from similar studies, and other relevant evidence -yes |
| Generalisability | 21 | Discuss the generalisability (external validity) of the study results -Yes, and is very generalizable based on the included population’s co. morbidities and prevalent use of OCPs |
| Other information | ||
| Funding | 22 | Give the source of funding and the role of the funders for the present study and, if applicable, for the original study on which the present article is based – Funding not discussed. Other studies upon what this is based were. |
Statin and Cataracts:
Are the results of the study valid?
Primary guide:
Were there clearly identified comparison groups that were similar with respect to important determinants of outcome, other than the one of interest
-yes
Were the outcomes and exposures measured in the same way in the groups being compared?
-yes
Was follow up sufficiently long and complete?
Secondary guide:
Is the temporal relationship correct?
-yes
Is there a dose-response gradient?
-No. Dosage were not included. Also not included was the potency of the statins.
| Item No | Recommendation | ||||
| Title and abstract | 1 | Indicate the study’s design with a commonly used term in the title or the abstract -Yes | |||
| Provide in the abstract an informative and balanced summary of what was done and what was found -Yes | |||||
| Introduction | |||||
| Background/rationale | 2 | Explain the scientific background and rationale for the investigation being reported -Yes | |||
| Objectives | 3 | State specific objectives, including any prespecified hypotheses -Yes, states objectives but no hypothesis. | |||
| Methods | |||||
| Study design | 4 | Present key elements of study design early in the paper -Yes | |||
| Setting | 5 | Describe the setting, locations, and relevant dates, including periods of recruitment, exposure, follow-up, and data collection -Yes | |||
| Participants | 6 | Give the eligibility criteria, and the sources and methods of case ascertainment and control selection. Give the rationale for the choice of cases and controls -Yes | |||
| Variables | 7 | Clearly define all outcomes, exposures, predictors, potential confounders, and effect modifiers. Give diagnostic criteria, if applicable -Very poor description of the variables within the analysis. | |||
| Data sources/ measurement | 8* | For each variable of interest, give sources of data and details of methods of assessment (measurement). Describe comparability of assessment methods if there is more than one group – not really given | |||
| Bias | 9 | Describe any efforts to address potential sources of bias -bias was addressed by mentioning the statistical adjustment for age, gender, DM, etc. | |||
| Study size | 10 | Explain how the study size was arrived at -yes, clear | |||
| Quantitative variables | 11 | Explain how quantitative variables were handled in the analyses. If applicable, describe which groupings were chosen and why -handled by way of multivariate analysis. | |||
| Statistical methods | 12 | Describe all statistical methods, including those used to control for confounding -yes | |||
| Describe any methods used to examine subgroups and interactions -yes | |||||
| Explain how missing data were addressed -yes | |||||
| ( | |||||
| Describe any sensitivity analyses “-sensitivity analysis to study what effect excluding residents who had used statins for less than a year would have on our results” | |||||
| Results | |||||
| Participants | 13* | Report numbers of individuals at each stage of study—eg numbers potentially eligible, examined for eligibility, confirmed eligible, included in the study, completing follow-up, and analysed -yes | |||
| Give reasons for non-participation at each stage yes | |||||
| Descriptive data | 14* | Give characteristics of study participants (eg demographic, clinical, social) and information on exposures and potential confounders -see table 1 | |||
| Indicate number of participants with missing data for each variable of interest -not present | |||||
| Outcome data | * | Report numbers in each exposure category, or summary measures of exposure -yes | |||
| Main results | 16 | Give unadjusted estimates and, if applicable, confounder-adjusted estimates and their precision (eg, 95% confidence interval). Make clear which confounders were adjusted for and why they were included -yes | |||
| Discussion | |||||
| Key results | 18 | Summarise key results with reference to study objectives -yes | |||
| Limitations | 19 | Discuss limitations of the study, taking into account sources of potential bias or imprecision. Discuss both direction and magnitude of any potential bias -yes | |||
| Interpretation | 20 | Give a cautious overall interpretation of results considering objectives, limitations, multiplicity of analyses, results from similar studies, and other relevant evidence -present and caution interpretation of their results | |||
| Generalisability | 21 | Discuss the generalisability (external validity) of the study results -addressed generalizability | |||
| Other information | |||||
| Funding | 22 | Give the source of funding and the role of the funders for the present study and, if applicable, for the original study on which the present article is based -yes | |||
Report your critical appraisal findings in your blog post. Is the study methodologically sound? Does it have any flaws? What effect, if any, does any flaw have on the results? Your post for this portion of the assignment should have 2 sections (one for each study): one for the results from your critical appraisal and one discussing if you think the study is methodologically valid and why/why not. Each critical appraisal section should have the questions from the tool and your answer. Elaborate why you answered each question as you did.
Critical appraisal: I believe both studies were methodologically sound. I did not note any tremendous, disqualifying flaws though what flaws I did find are noted above. Each of these studies seemed to be designed appropriately.
I felt as though User’s guide was a superior tool to use in analyzing these studies. STROBE was cumbersome to use and I found myself focusing on checking the boxes more than actually analyzing the studies. I used the user’s guide second in the HRT paper and first in the Statin paper and felt as though I had a more thorough big picture understanding of the statin paper after my first pass. I see myself using the user’s guide for observational studies as this is simply more *user* friendly.
Are the results in the study valid?
Primary Guides
Secondary Guides:
QUADAS-2
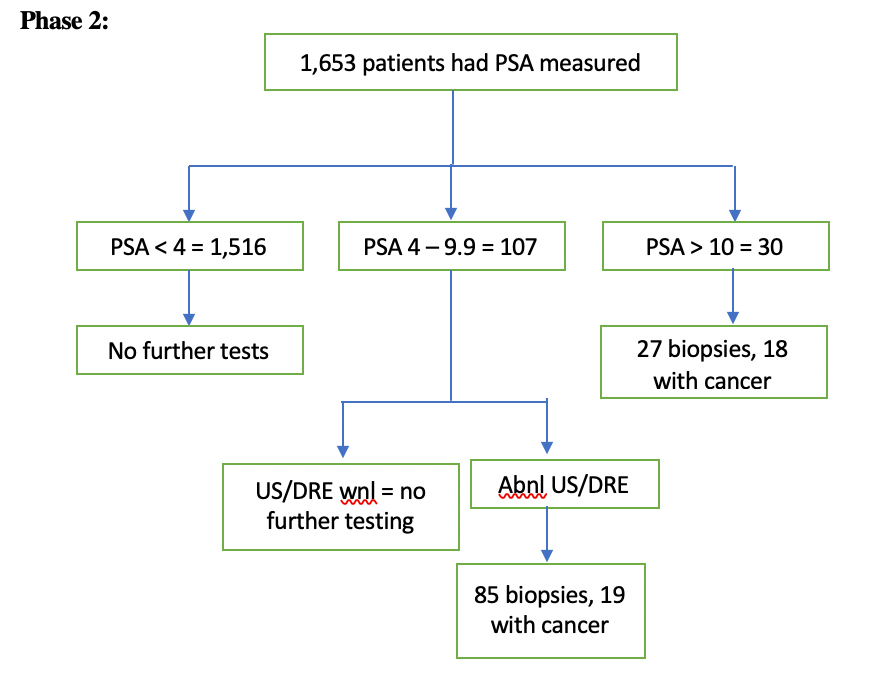
Phase 1:
Asymptomatic males with no PMH of prostate cancer or prostatitis underwent cancer screening by way of serum PSA levels. If persistently elevated, these levels were followed up with DRE and US. If DRE and/or US were non-benign, the individual then underwent prostate biopsy (reference standard) to evaluate for prostate cancer (target condition).
Phase 3:
Domain 1:
Could the selection of patients have introduced bias? Low risk.
Is there concern that the included patients do not match the review question? Low concern.
Domain 2:
Domain 3:
Domain 4:
As far as comparing the User’s Guides and the QUADAS-2, I believe they both have their strengths. Personally I felt that the User’s Guides was more ~user~ friendly and allowed me to focus more on the actual article where as I felt the QUADAS-2 format was cumbersome and felt a little like busy work. That being said, the QUADAS-2 did seem more comprehensive in its methodology of combing through the study. I think that I would be more inclined to use the User’s Guides as my frame of reference and the QUADAS-2 if I felt like there were flaws in the study that I wasn’t completely picking up using the User’s Guides alone.
Priests have their holy books, farmers have their almanacs, and third year medical students have their UpToDate log in information.
In line with so many other medical students across the country, my day to day resource is UpToDate. It has served as a great tool students can use to “not look dumb” on rounds, or so I have been told. It falls within the “synthesis summaries” level of evidence hierarchy. Living up to its name, it is typically on the cutting edge of the newest data that are available. What immediately comes to my mind is an experience during my Gyn-Onc rotation a few weeks back. We had a 6:45 conference detailing all the new rage that is the usage of PARP-inhibitors in the treatment of some ovarian cancers. The lecture covered 2 NEJM articles that had been released in the month prior. While the fellow was reviewing the ins and outs of the studies, I was doing what any good medical student on Gyn-Onc does in the morning: attempting to memorize my patient presentations. Little did I know that I would be fielding questions about this PARP-i lecture an hour later outside the room of one of my patients who had presented with metastatic ovarian cancer. After the 4th or 5th straight wiff I was told to read up on the studies and be ready for questions tomorrow. UpToDate had a great synopsis about these studies on the treatment of ovarian cancer that I was able to use to efficiently read up on the topic. I never would field another PARP-i question but at least I can say I gave it the good ole college try. I would argue that the main limitation of UpToDate is that it is so often “a mile wide and an inch deep” and may be incomplete in its coverage of a particular topic. In my experience it is wonderful at covering the “bread and butter” knowledge needed to manage a disease process but is often lacking when the knowledge desired is particularly subspecialized or outside of the norm.
I found the ACCESSSS federated search engine to be an efficient tool for reviewing the literature on certain topics. I used it to review the evidence on the management of gestational diabetes and was greeted with a breadth of knowledge ranging from lifestyle changes to the management of DKA. I liked that it stratified the literature by evidence hierarchy. I also found it interesting to see how different types of literature stratify between the evidence hierarchies. I feel like the only limitation that it may have for me is that I am already used to utilizing UpToDate. I have an app on my phone that is always logged in and ready to go and force of habit is a difficult thing to overcome. I believe as I progress through my education, a resource that is more comprehensive such as ACCESSSS would be useful in matching up my level of training with the depth of knowledge I should desire from my educational resources.
This is an example post, originally published as part of Blogging University. Enroll in one of our ten programs, and start your blog right.
You’re going to publish a post today. Don’t worry about how your blog looks. Don’t worry if you haven’t given it a name yet, or you’re feeling overwhelmed. Just click the “New Post” button, and tell us why you’re here.
Why do this?
The post can be short or long, a personal intro to your life or a bloggy mission statement, a manifesto for the future or a simple outline of your the types of things you hope to publish.
To help you get started, here are a few questions:
You’re not locked into any of this; one of the wonderful things about blogs is how they constantly evolve as we learn, grow, and interact with one another — but it’s good to know where and why you started, and articulating your goals may just give you a few other post ideas.
Can’t think how to get started? Just write the first thing that pops into your head. Anne Lamott, author of a book on writing we love, says that you need to give yourself permission to write a “crappy first draft”. Anne makes a great point — just start writing, and worry about editing it later.
When you’re ready to publish, give your post three to five tags that describe your blog’s focus — writing, photography, fiction, parenting, food, cars, movies, sports, whatever. These tags will help others who care about your topics find you in the Reader. Make sure one of the tags is “zerotohero,” so other new bloggers can find you, too.
